Read the receipts and forecast charts
The bottom row of the dashboard is about cash rather than debt. On the left, what actually came in. On the right, what Finaxis expects over the next three months. Both are full-width charts instead of small tiles, and both open a window with a month-by-month table. This article explains how to read them and how the forecast is built.
Receipts
Receipts totals the payments you received over the period, aggregated by month, in your instance base currency. It counts money that landed, so a payment recorded against a very old invoice still shows up in the month it was received.
- On the dashboard, read the period total at the top right of the RECEIPTS card.
- Read the curve for the shape: a dip tells you a month that under-collected.
- Click the card to open the window.
- Read the month-by-month table, which repeats each month amount and its variation against the month before.
- Change the period with 6 months, 1 year, By month, or Custom to redraw both the chart and the table.
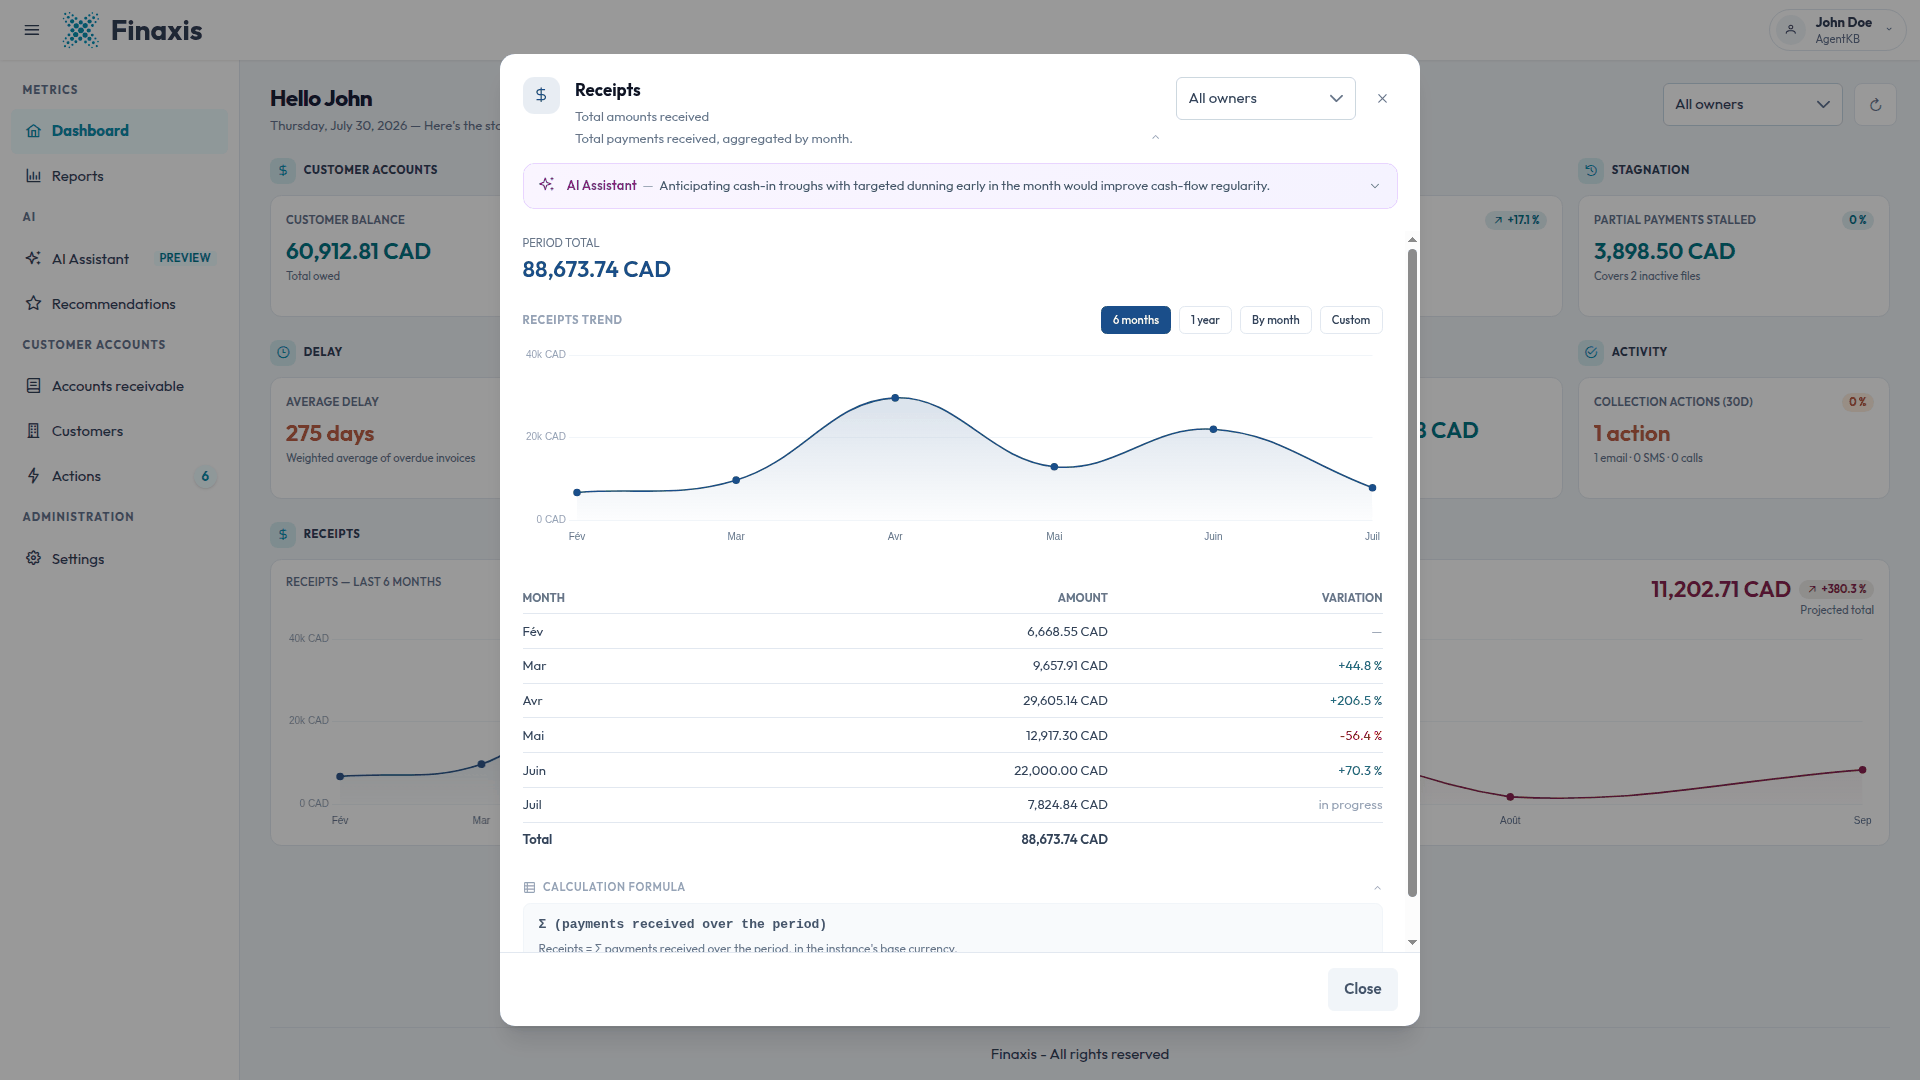
Please note: The current month is flagged in progress in the variation column, because it is not finished yet. Do not read it as a drop against last month until the month closes.
Receipts forecast
The forecast projects the next three months from your current open balance. Finaxis does not assume every invoice will be paid: it weights each aging range by how likely that money is to arrive, then adjusts for when it is expected.
| Range | Collection probability |
|---|---|
| Current | 95 % |
| 1-30 d | 85 % |
| 31-60 d | 60 % |
| 61-90 d | 35 % |
| 91+ d | 15 % |
The window shows the projected total, a month-by-month projection, and a Collection probability by aging bucket table giving your outstanding balance, the probability, and the projected contribution for each range.
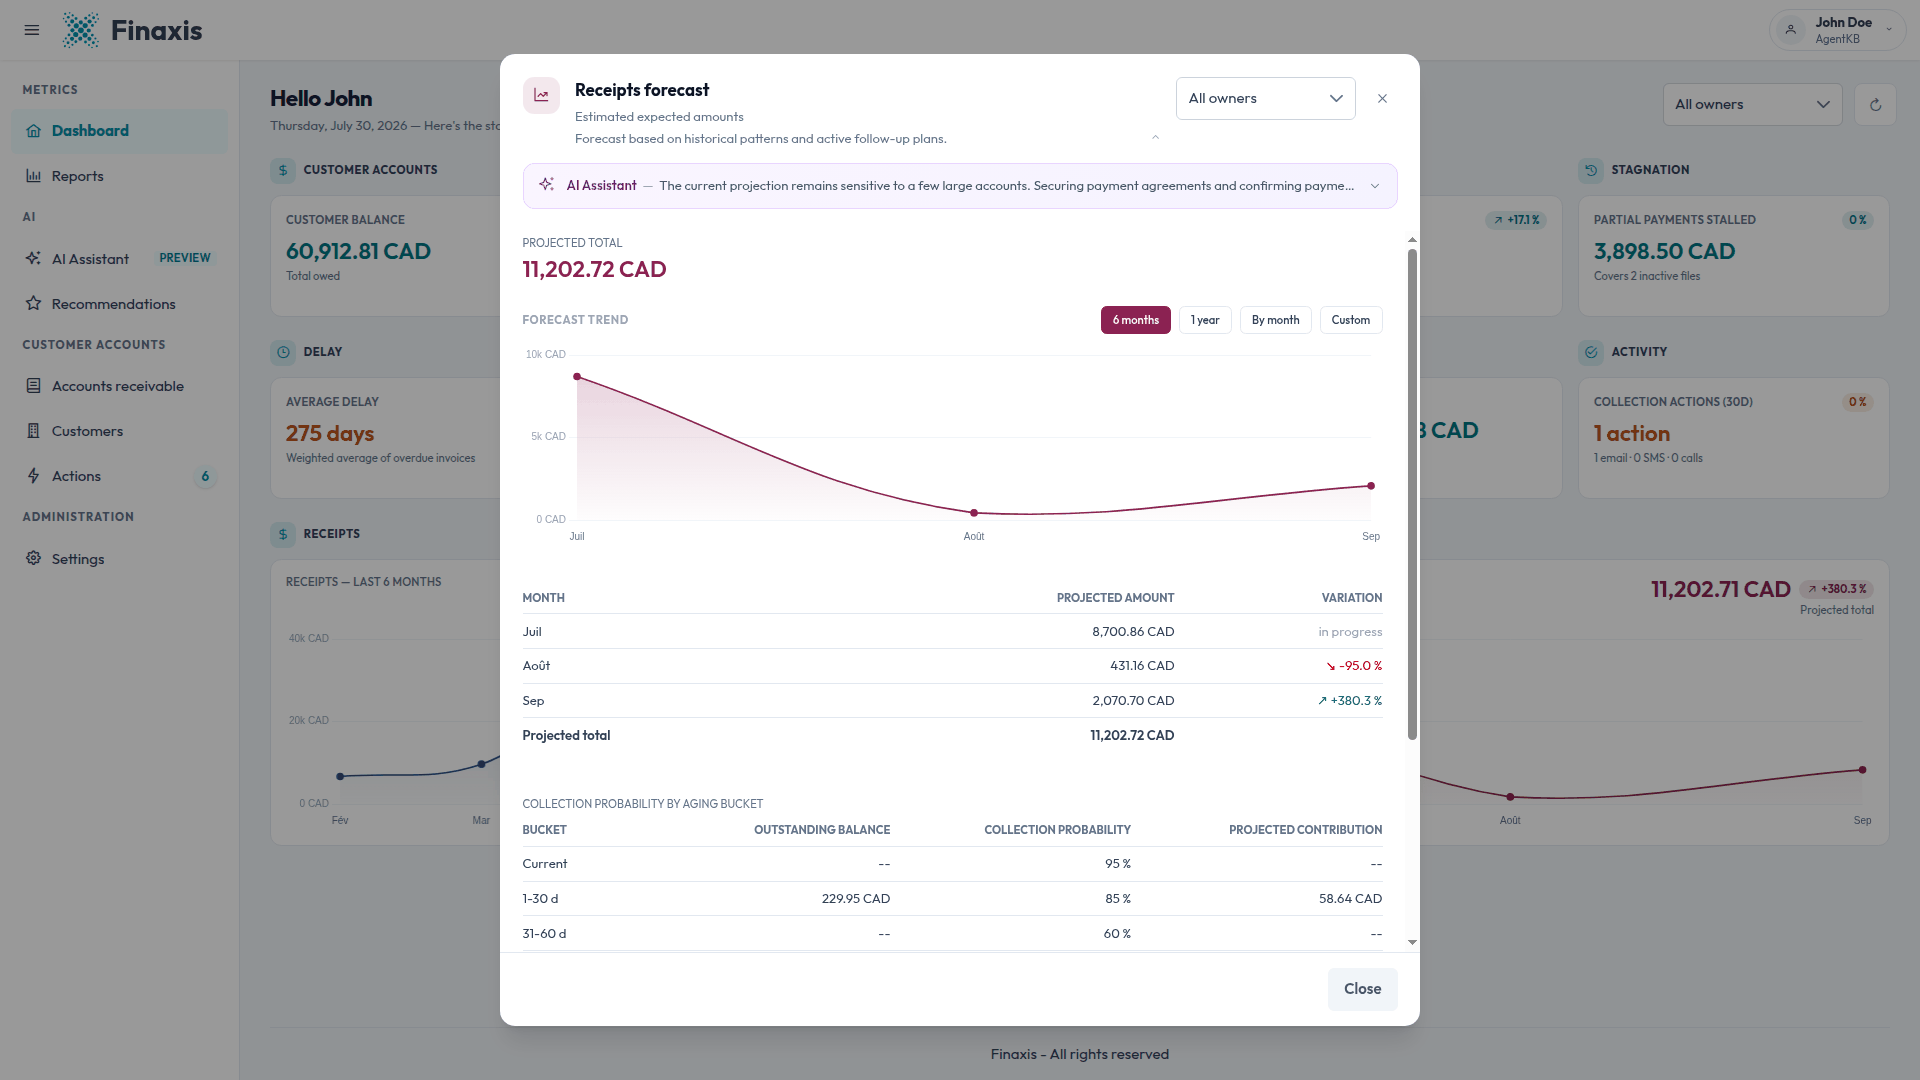
Please note: A row in that table can be slightly below its balance multiplied by its probability. The projected contribution also reflects an adjustment for the expected payment date, so money expected beyond the horizon is not counted in full.
Why the forecast is lower than you expect
The probabilities fall steeply with age, and that is the point. A portfolio where most of the balance sits in the 91 and over range projects only a fraction of that balance, because history says most of it will not arrive on time.
- Old balances contribute little. Moving money out of the oldest ranges is what lifts the forecast.
- The forecast covers three months only. It is a cash planning horizon, not a recovery estimate.
- The projection follows the account owner selected in the window, so a manager can plan their own portfolio.
- Collecting an old invoice raises the forecast twice over: the balance leaves a low-probability range, and the receipt shows up in your receipts chart.
Reading the two charts together
Compare the shape of the receipts curve with the projected months. Receipts well above the forecast for several months means the forecast is conservative for your customer base. Receipts consistently below it means the probabilities are optimistic for you, and the aging ranges deserve a closer look.
Please note: These two charts follow the period set inside their own window. The Reports section of the menu has its own period selector for collection history, so two totals will differ unless you match the windows.
Troubleshooting
| Situation | What to do |
|---|---|
| The current month looks like a collapse | It is marked in progress and only counts the days elapsed. Wait for the month to close before comparing it. |
| The forecast is far below my open balance | Read the collection probability table. A balance concentrated in the oldest ranges projects at 15 %. |
| A projected row is below balance multiplied by probability | That is expected. The projection also adjusts for the expected payment date. |
| Receipts show nothing for a month I know we collected in | Receipts follow the payment date recorded on the payment. Check the payment reached Finaxis and carries the right date. |
| My receipts total does not match the Reports section | The two use separate period selectors. Set both to the same window before comparing. |
| The month names on these charts are not in my language | The month labels of these two charts are written by Finaxis and can appear in French on an English screen. The amounts and the totals are unaffected. |
Planning cash from these charts? Expand Calculation formula in each window for the exact calculation, and write to support@finaxis.ai if a projection looks wrong for your business.
Related articles
Can't find what you're looking for?
Our support team is here to help.