Read the balance and delay tiles
Seven of the twelve dashboard tiles describe money you are owed and how late it is. Four of them are variations on the same balance, which is why they can show the same amount on a portfolio where everything is already overdue. This article gives the exact definition of each one, and the practical difference between them.
The four balances at a glance
| Tile | What it sums | Read it when |
|---|---|---|
| Customer balance | Everything owed by your active customers, across all five aging ranges. | You want the single headline figure for your portfolio. |
| Balance without follow-up | The unpaid balance of customers who have no message scheduled in the send queue. | You want to know what is not being chased yet. |
| Overdue balance | The four late ranges added together. It excludes amounts not yet due. | You want the part of the balance that is actually past its due date. |
| 91 days and over | The oldest range on its own, plus the customers behind it. | You want the exposure that is least likely to be recovered. |
Please note: The four figures are equal on a portfolio where every open invoice is late and no customer has a scheduled message. That is a real state, not an error. Read the small label under each amount to tell the tiles apart.
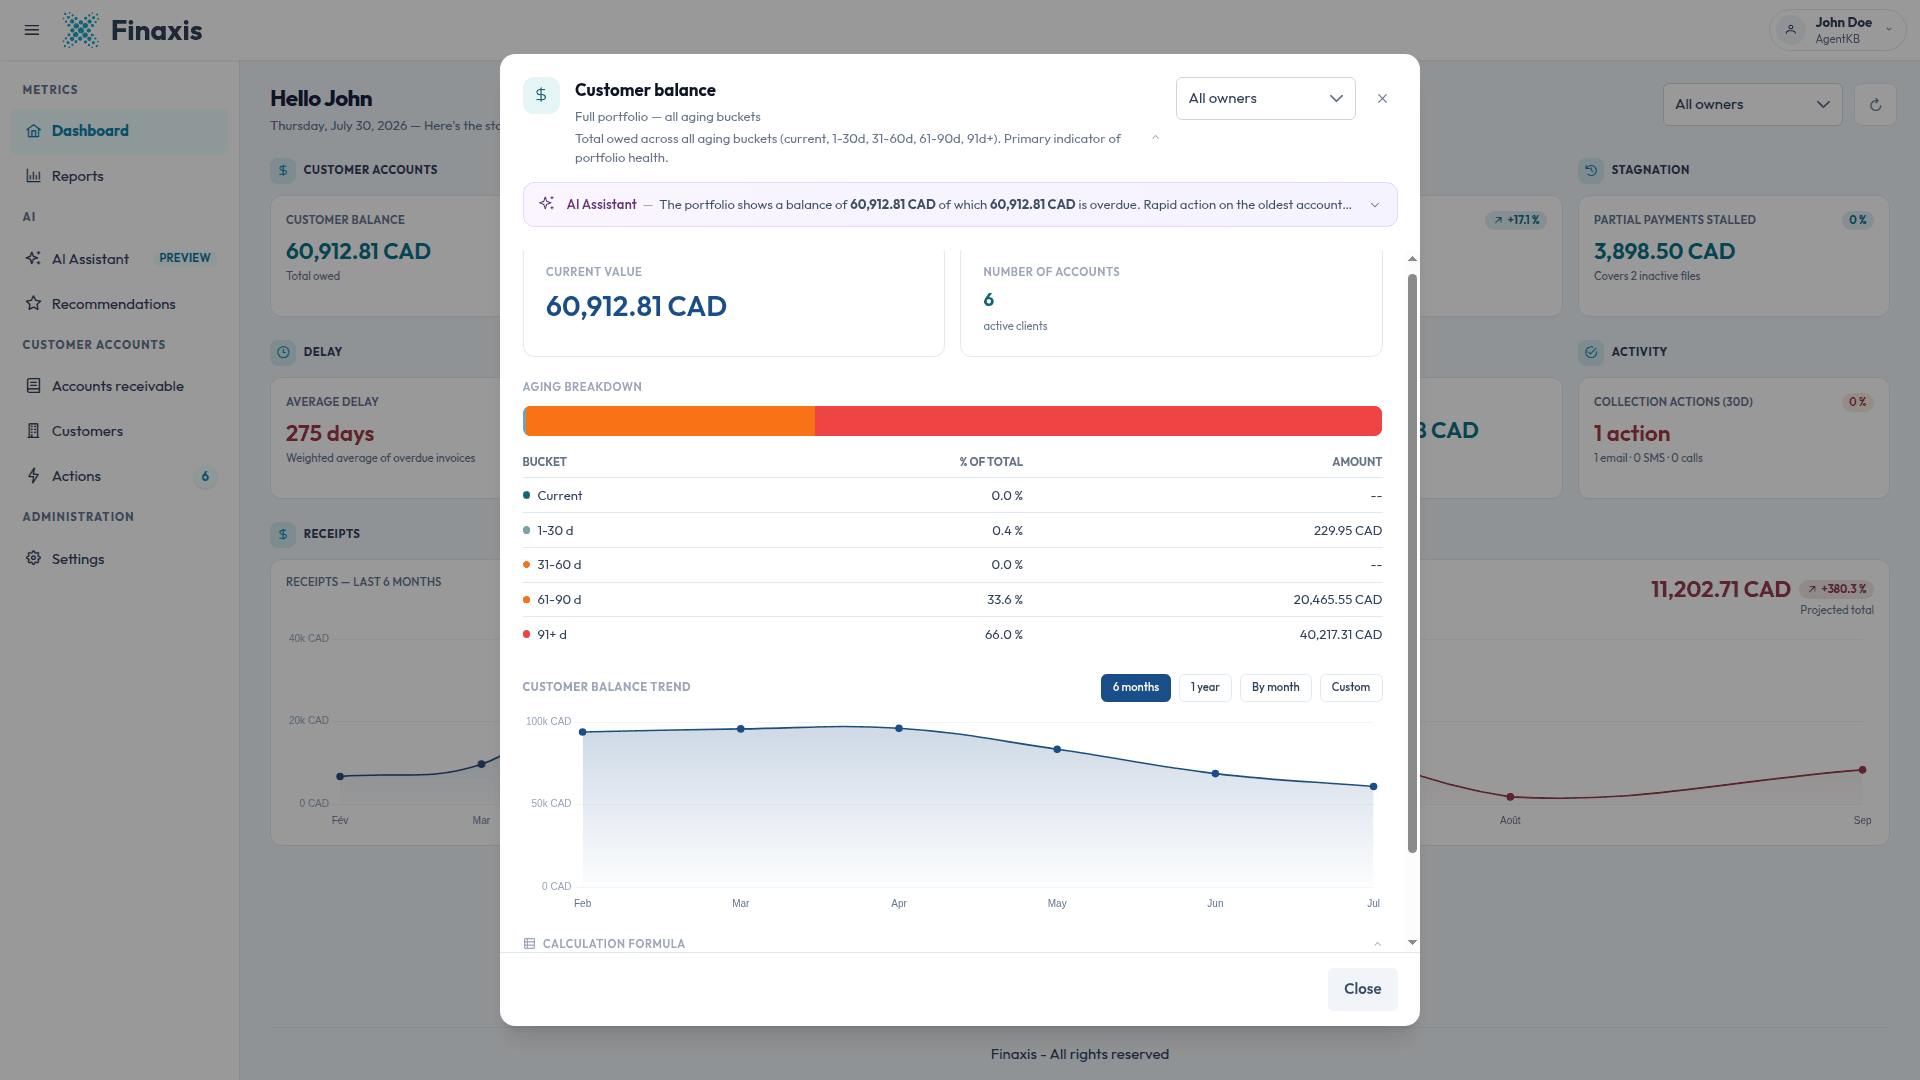
Customer balance
This is the primary indicator of portfolio health: the total owed by your active customers, all aging ranges included. The window adds the number of active accounts and the full aging breakdown.
| Range | Meaning |
|---|---|
| Current | Not due yet. |
| 1-30 d | One to 30 days past due. |
| 31-60 d | 31 to 60 days past due. |
| 61-90 d | 61 to 90 days past due. |
| 91+ d | More than 90 days past due. |
Each row shows its share of the total and its amount, and each row is a link: click it to open your accounts receivable list filtered on that range.
Balance without follow-up
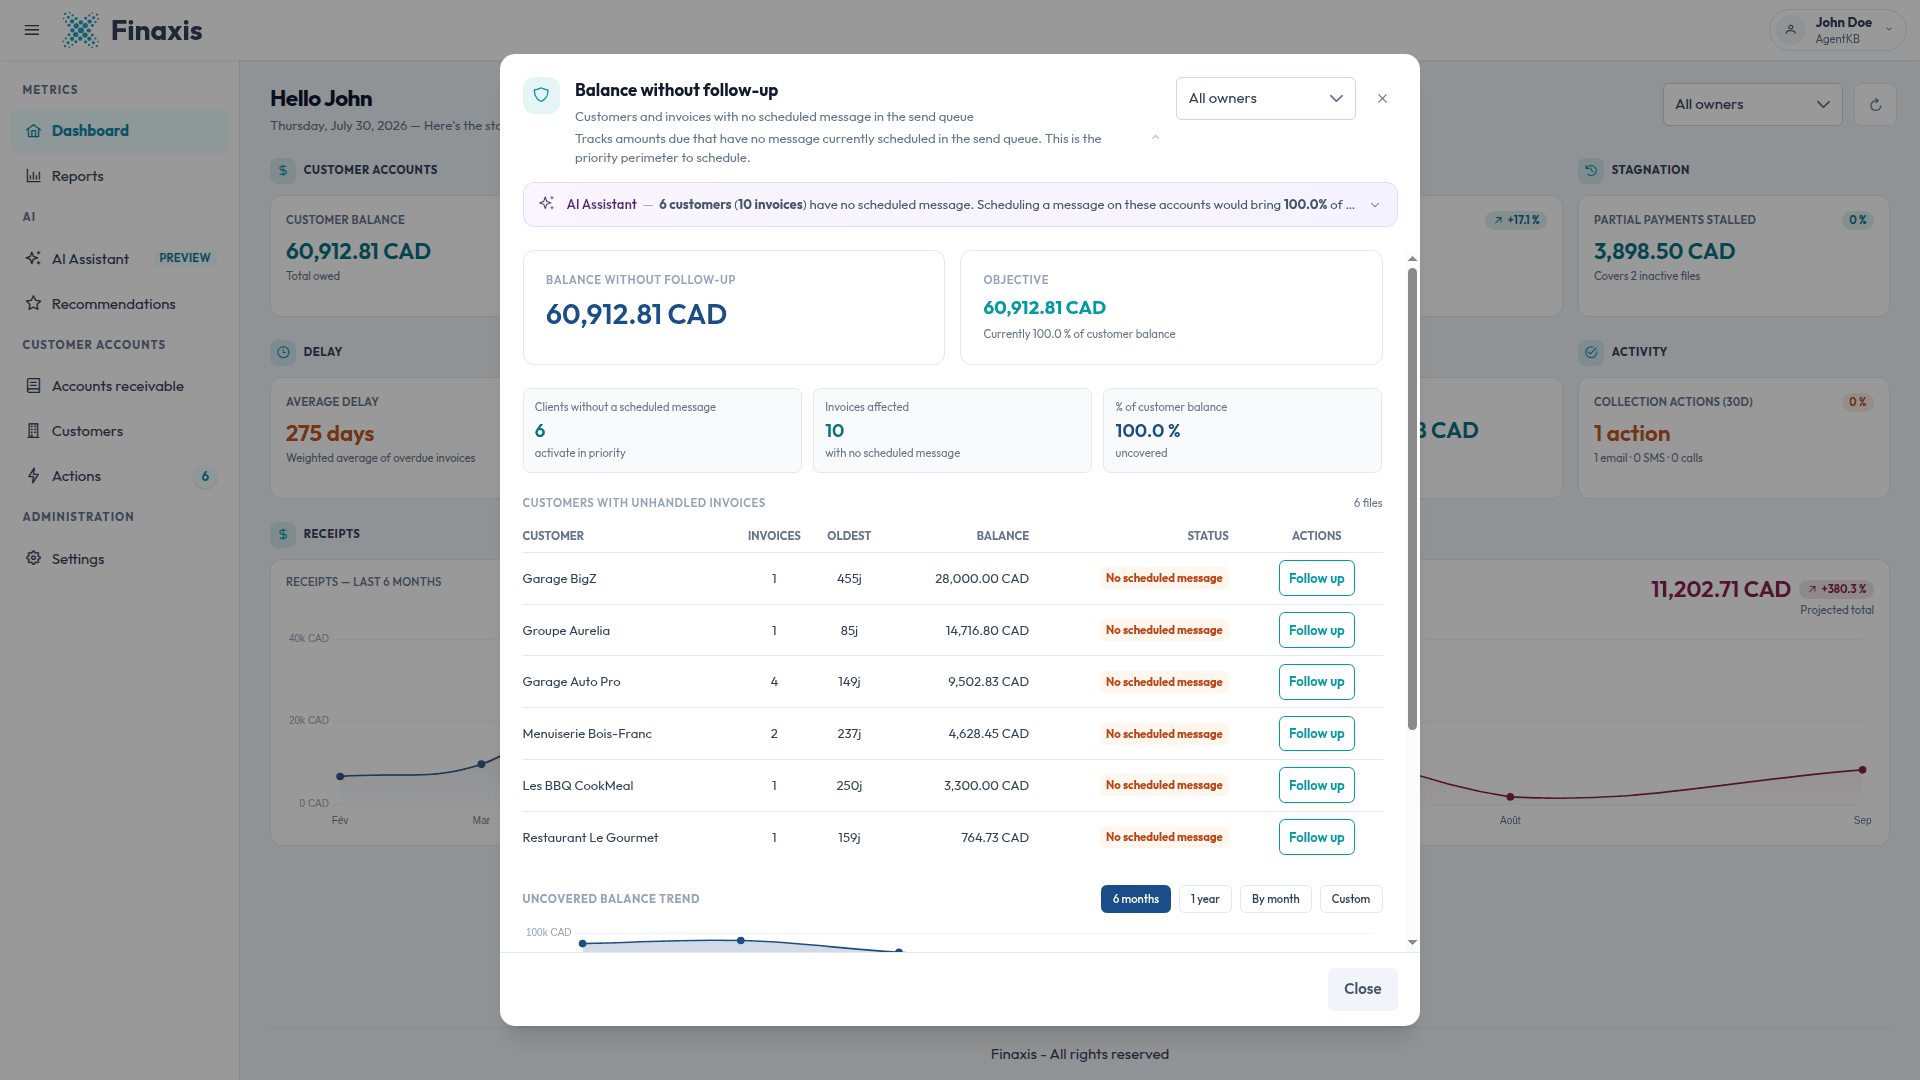
This tile answers a question none of the others do: how much of what you are owed has nothing scheduled against it. It sums the unpaid balance of every customer with no message waiting in the send queue, which makes it your priority list.
- The window reports the number of customers concerned, the number of invoices, and the share of your customer balance they represent.
- The table lists each customer with its invoice count, the age of its oldest invoice, its balance, and a No scheduled message status.
- Click Follow up on a row to start a reminder for that customer without leaving the window.
Please note: Scheduling a message on a customer removes it from this tile. The figure is a measure of coverage, not of risk, so a low number here is good news even when your balance is high.
Overdue balance
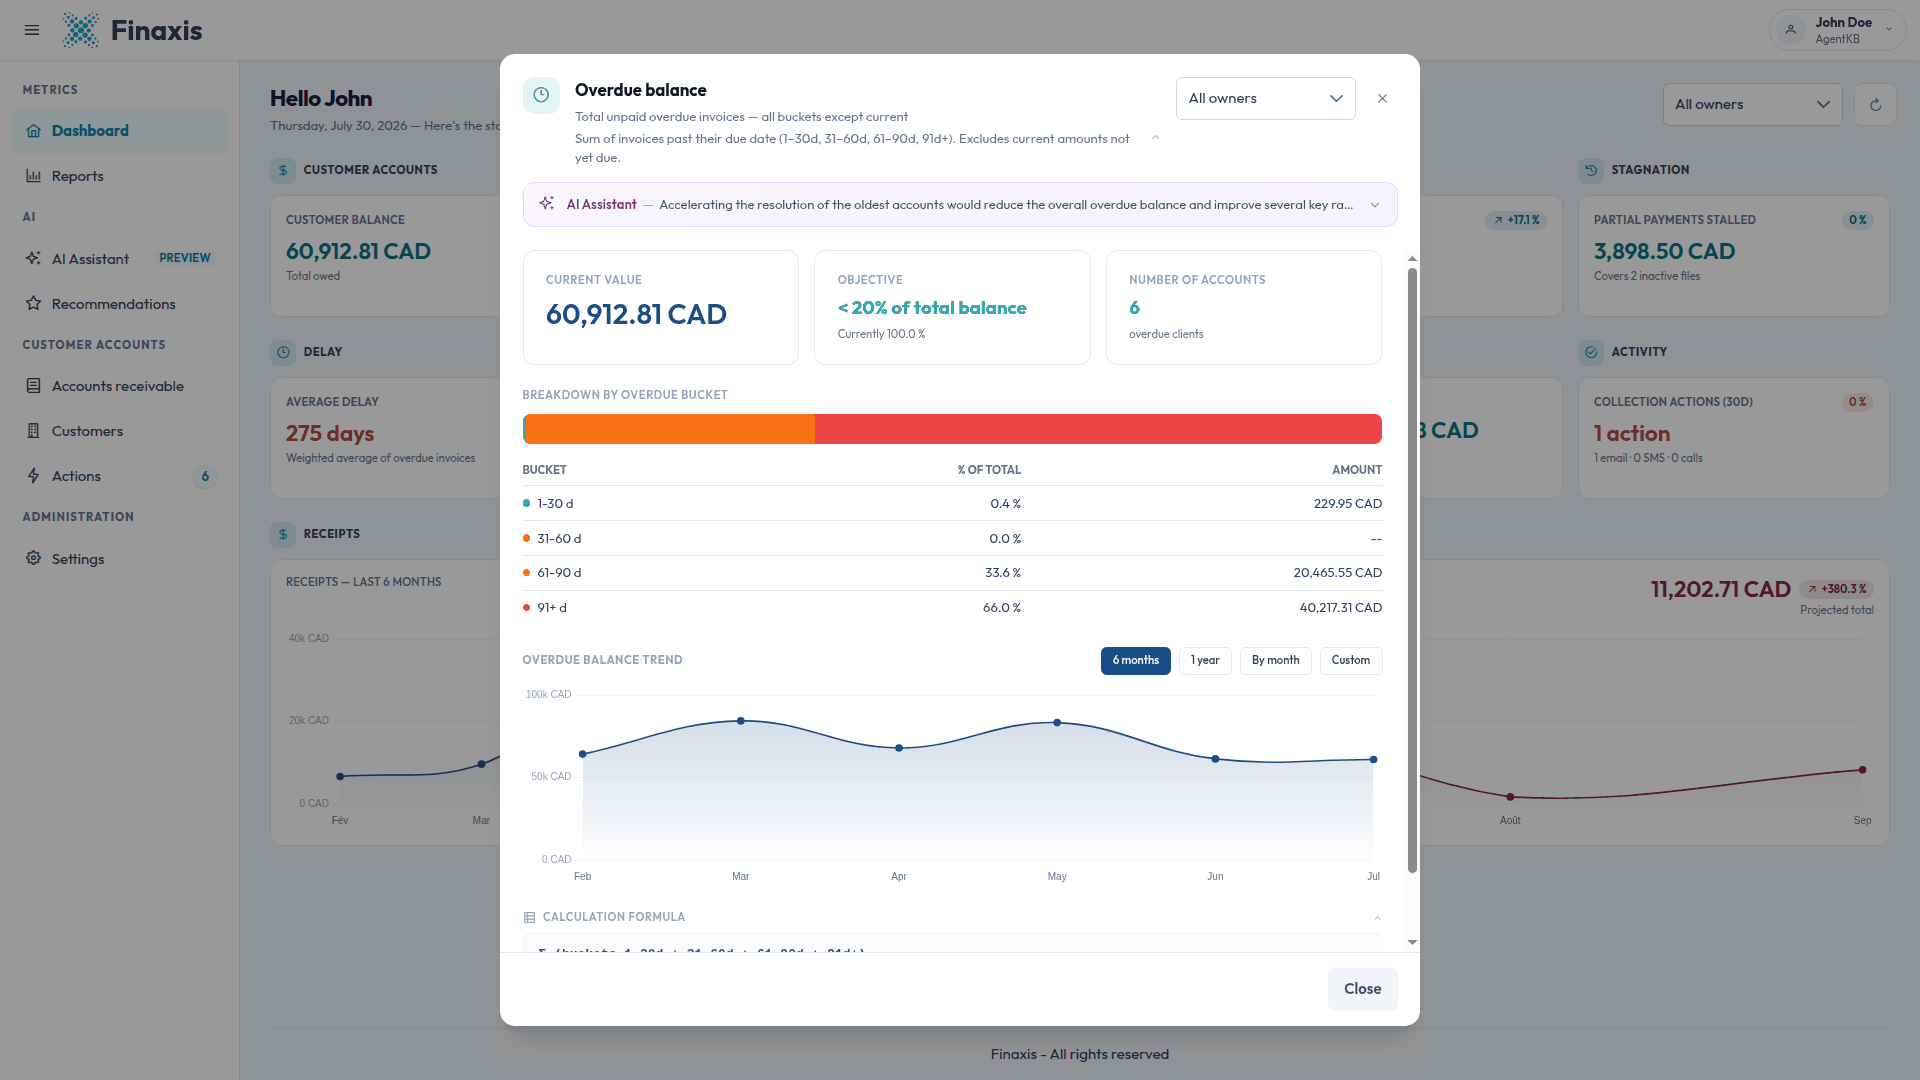
The overdue balance is the sum of the four late ranges: 1-30, 31-60, 61-90, and 91 and over. Amounts that are not due yet are excluded, so this tile is always smaller than or equal to your customer balance.
Because it is built by adding the ranges, the headline always matches its own breakdown table to the cent. The window also compares your overdue share against a reference of < 20 % of total balance.
91 days and over
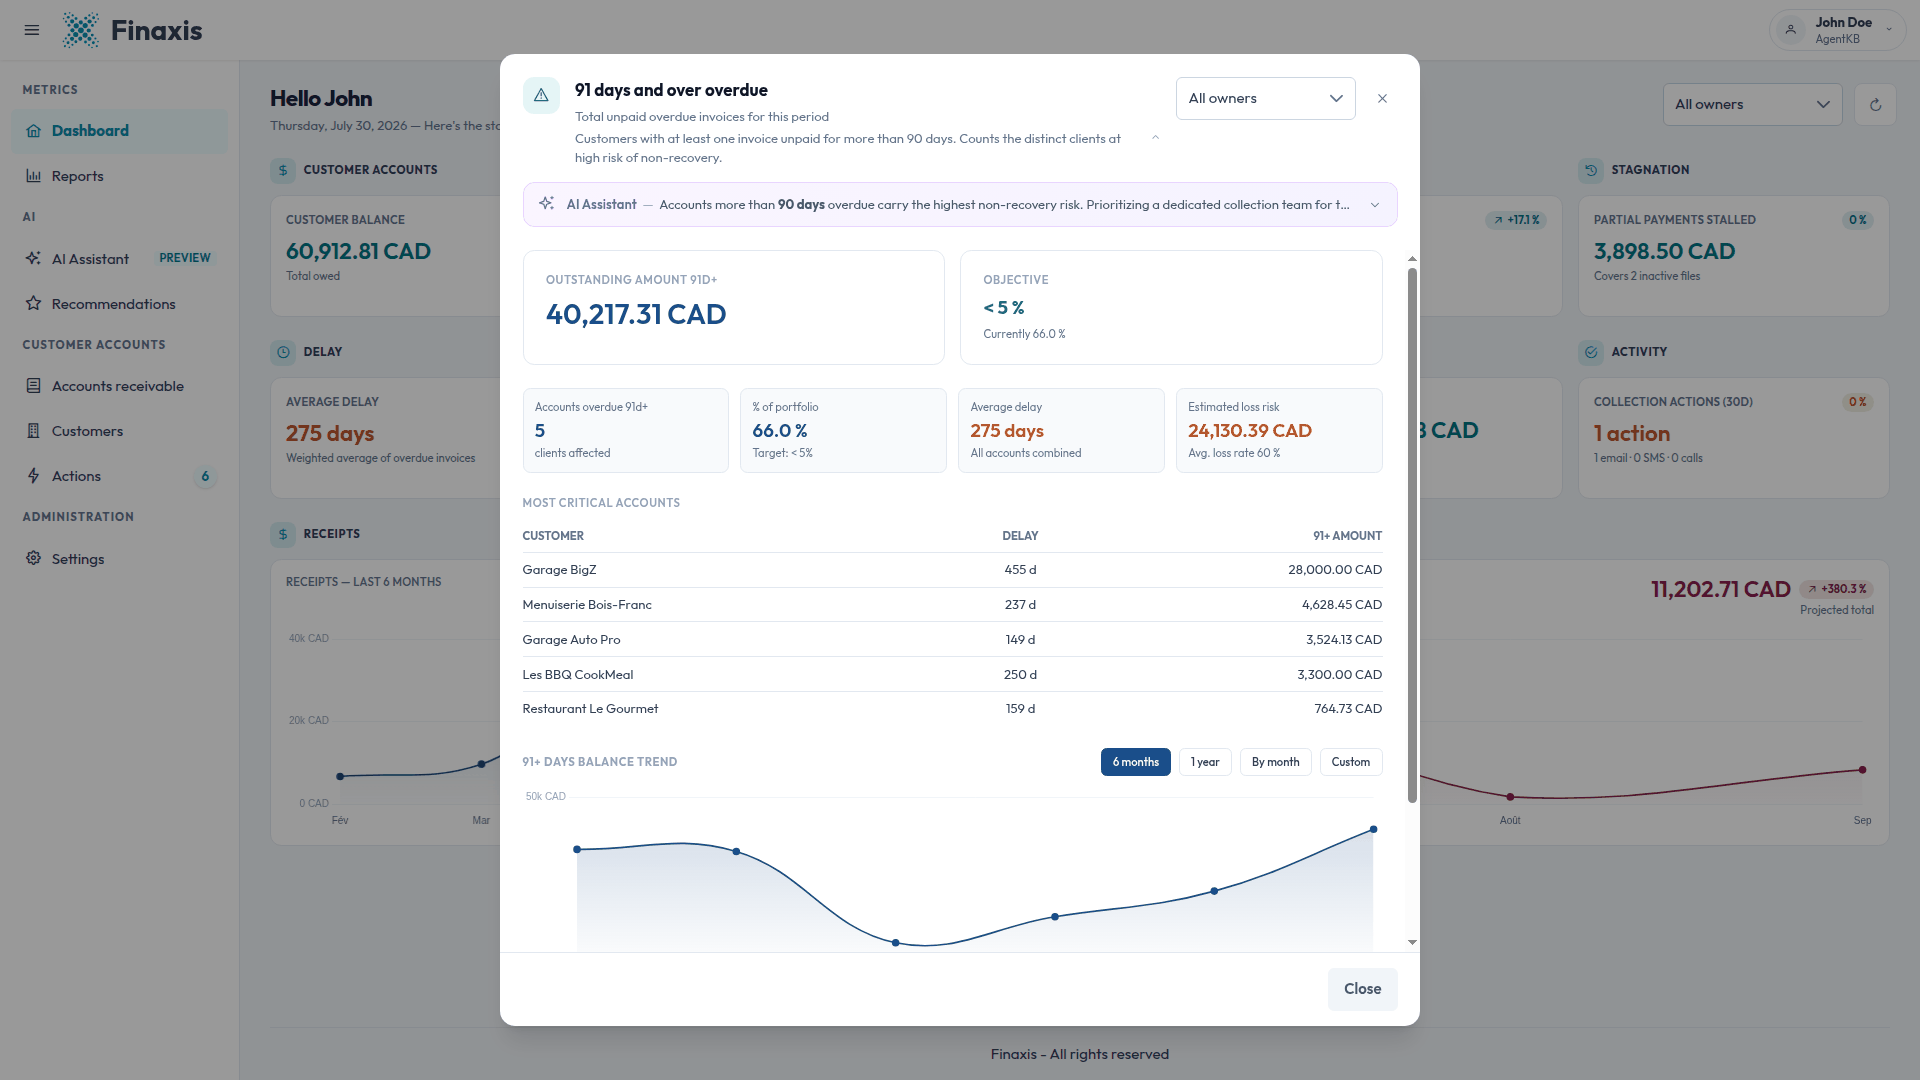
This tile isolates your oldest exposure: customers with at least one invoice unpaid for more than 90 days. Its window is the most detailed of the four, because these are the accounts that turn into write-offs.
- The outstanding amount in the 91 and over range, and the number of customers affected.
- The share of your portfolio it represents, against a reference of < 5 %.
- The average delay across all accounts, for context.
- An Estimated loss risk, calculated at an average loss rate of 60 % of the 91 and over amount.
- A Most critical accounts table ranking the customers by their 91 and over amount, with the days each one is late.
Please note: The estimated loss risk is an indicative figure built on a flat 60 % loss rate. It is a prompt to act on these accounts, not an accounting provision.
Partial payments stalled
This tile catches a case the aging ranges hide: an invoice that received a partial payment, then went quiet. Finaxis counts a file as stalled when it has had no payment activity for more than 60 days.
- The amount is the total remaining balance of those files.
- The table gives the customer, the invoice number, the amount left to pay, and the date of the last payment with the days elapsed since.
- Click Remind on a row to re-engage that customer.
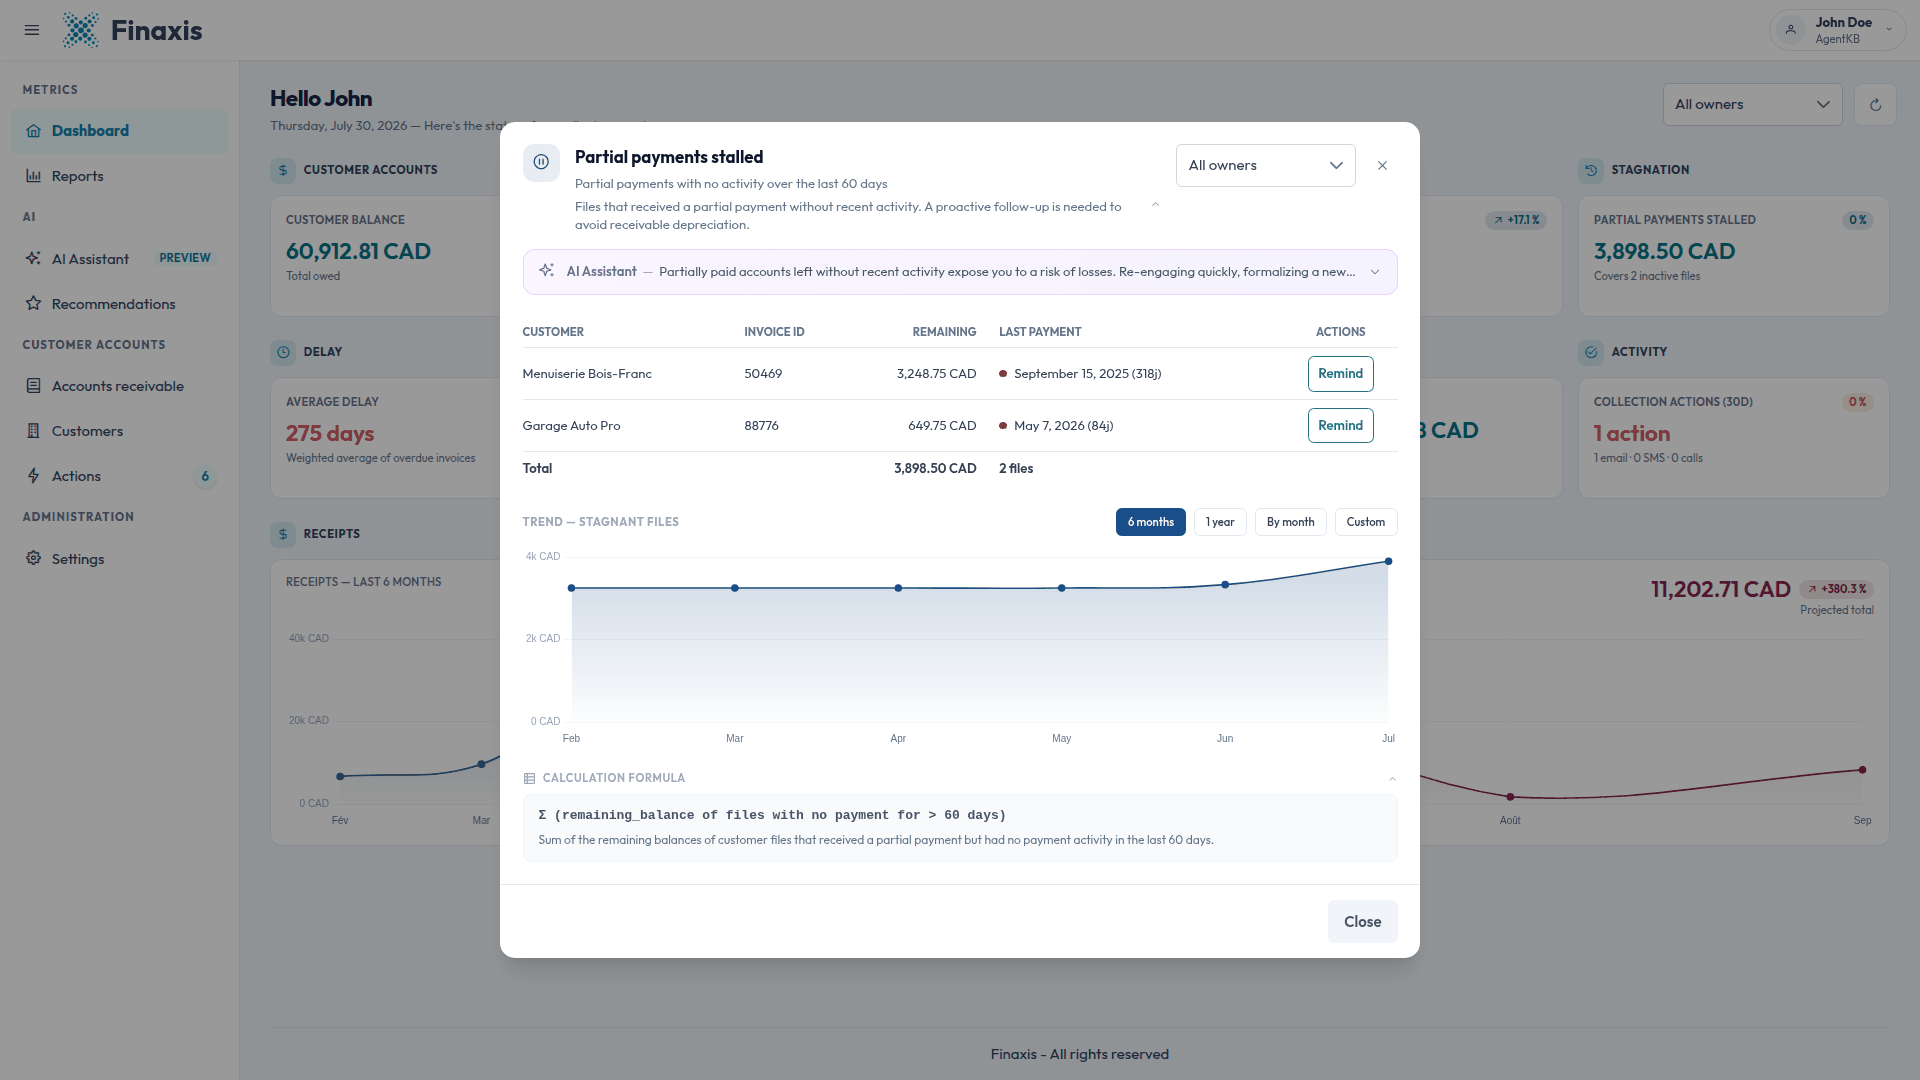
A customer who paid part of an invoice has acknowledged the debt, which usually makes these files easier to recover than a silent account of the same age. That is why they get their own tile.
Average delay
Average delay is the time between an invoice due date and today, averaged across your overdue invoices and weighted by amount. The larger an invoice, the more its delay moves the figure. The window shows the target, a gauge, and an indicative breakdown giving the weighted average days in each aging range.
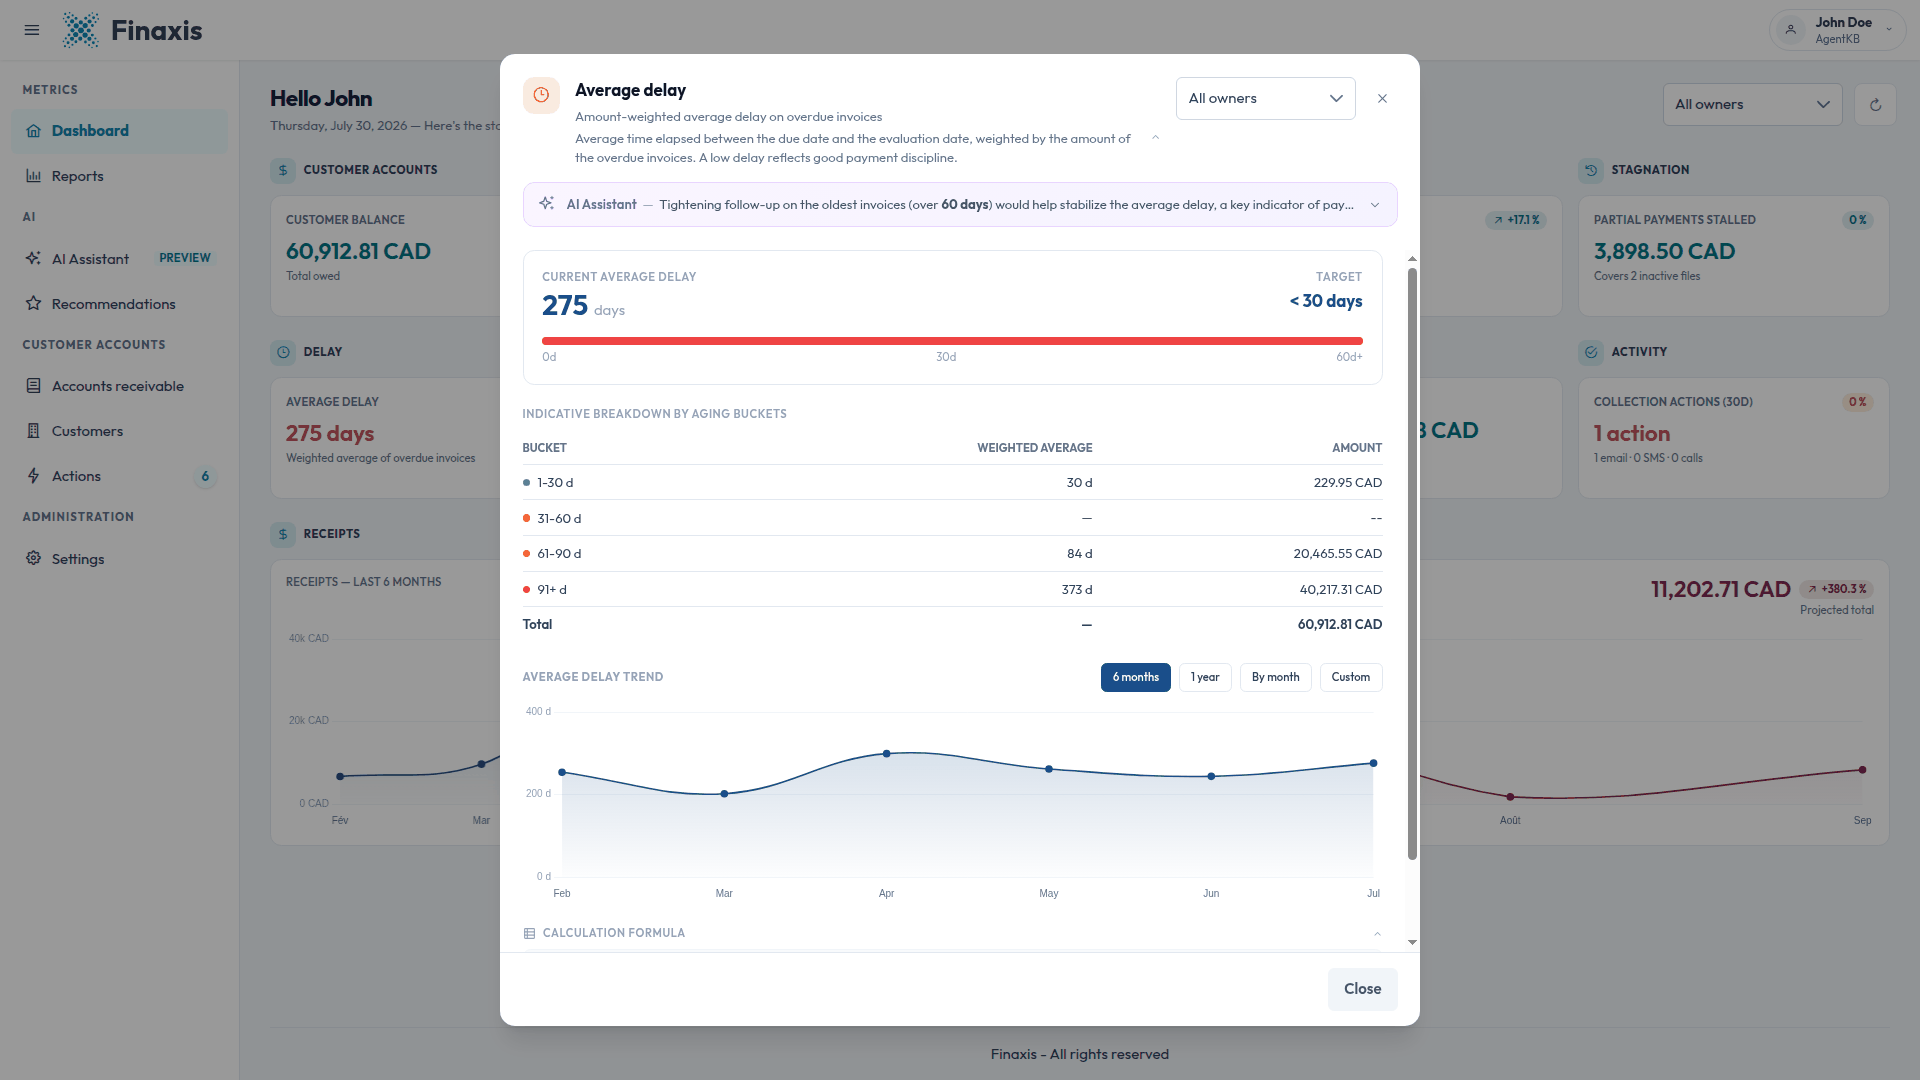
Please note: This is not the time your customers take to pay. It measures how late your open balance is right now, so it keeps climbing while an invoice stays unpaid. For the invoice-to-payment delay on money already collected, open the Reports section of the menu.
Because the average is weighted by amount, one large old invoice can pull the figure well above what most of your accounts look like. Read the breakdown table to see where the weight actually sits.
Top 5 overdue accounts
This tile ranks the five customers whose overdue invoices total the most, and reports what share of your whole overdue balance they carry. On many portfolios that share is most of it, which tells you where to spend your morning.
- The Top 5 total and the share of overdue balance it represents.
- A ranked table with each customer overdue balance, its delay in days, and the date of its oldest invoice.
- A Follow up action on every row.
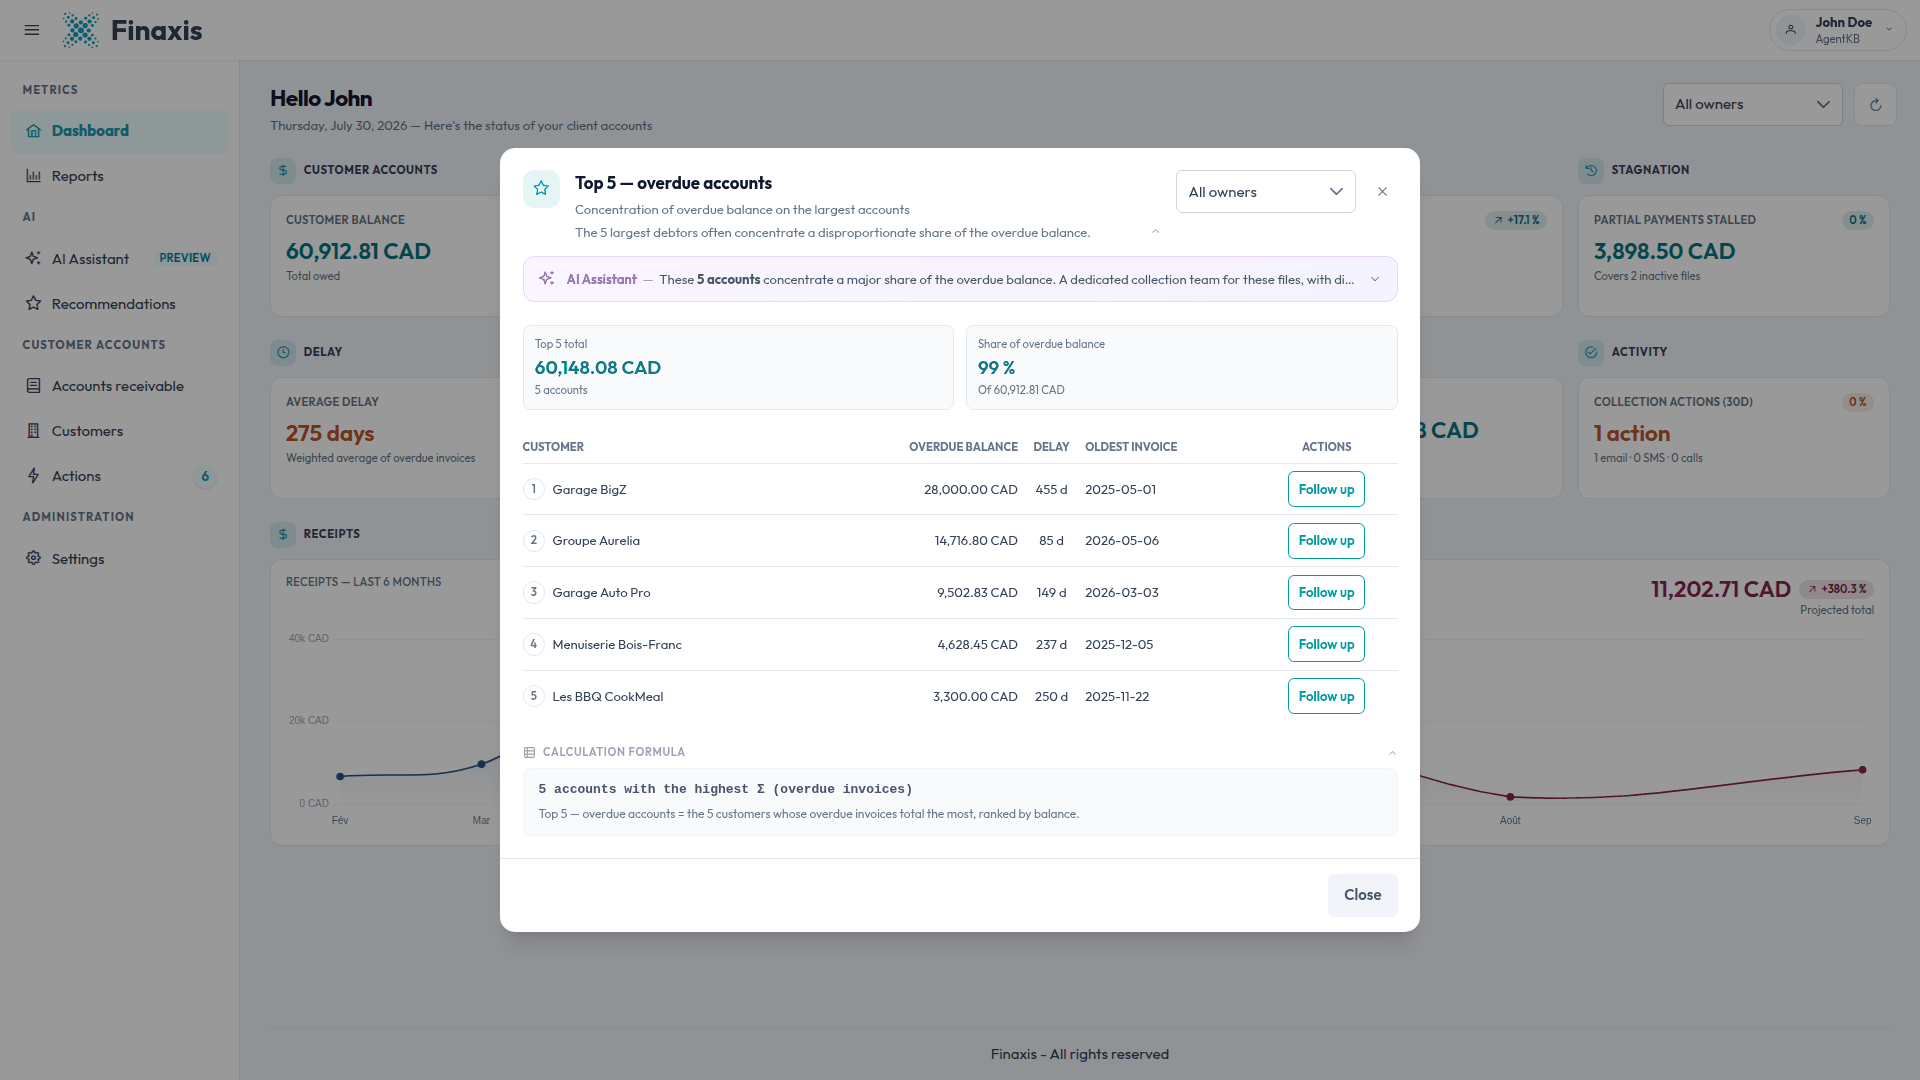
Please note: This window has no trend chart. It describes who owes you the most right now rather than a movement over time.
Troubleshooting
| Situation | What to do |
|---|---|
| Overdue balance equals customer balance | Every open invoice is past its due date and nothing is in the Current range. Open the Customer balance window and check the Current row is empty. |
| The average delay looks far too high | It is weighted by amount, so one large old invoice dominates it. Read the indicative breakdown to see which range carries the weight. |
| A customer appears in the 91 and over list but not in the Top 5 | The Top 5 ranks on total overdue balance, all ranges included. A very old but small account can be critical without being large. |
| The 91 and over amount differs from the same column on the aging report | Check that both are scoped the same way. The dashboard follows the account owner list in the header, and your aging report may carry filters or a saved view. |
| Balance without follow-up does not drop after I send a reminder | The tile counts messages scheduled in the send queue. Click Recompute the data in the header, then check the customer has a message waiting. |
Need the exact calculation for one of these tiles? Open it and expand Calculation formula at the bottom of the window. Still stuck, write to support@finaxis.ai.
Related articles
Can't find what you're looking for?
Our support team is here to help.