Read the risk, concentration, and activity tiles
Three dashboard tiles describe the quality of your receivables rather than their size. Risk level distribution grades your customers, concentration measures how much of the book sits on a few names, and collection actions tells you how much chasing actually happened. This article gives the calculation behind each one.
Risk level distribution
The tile shows a score out of 10 with a label, above a ring chart. Finaxis grades each customer into one of four risk levels based on its payment history, then turns the mix into a single score. A high score is bad news: 10 out of 10 means your whole balance sits on Critical customers.
| Level | Weight in the score |
|---|---|
| Low | Counts zero. |
| Moderate | Counts one. |
| High | Counts five. |
| Critical | Counts ten. |
Finaxis multiplies each level share of the balance by its weight, adds the results, and divides by 10. The window shows that arithmetic line by line in a Risk score calculation table, so you can see exactly which level is driving your score.
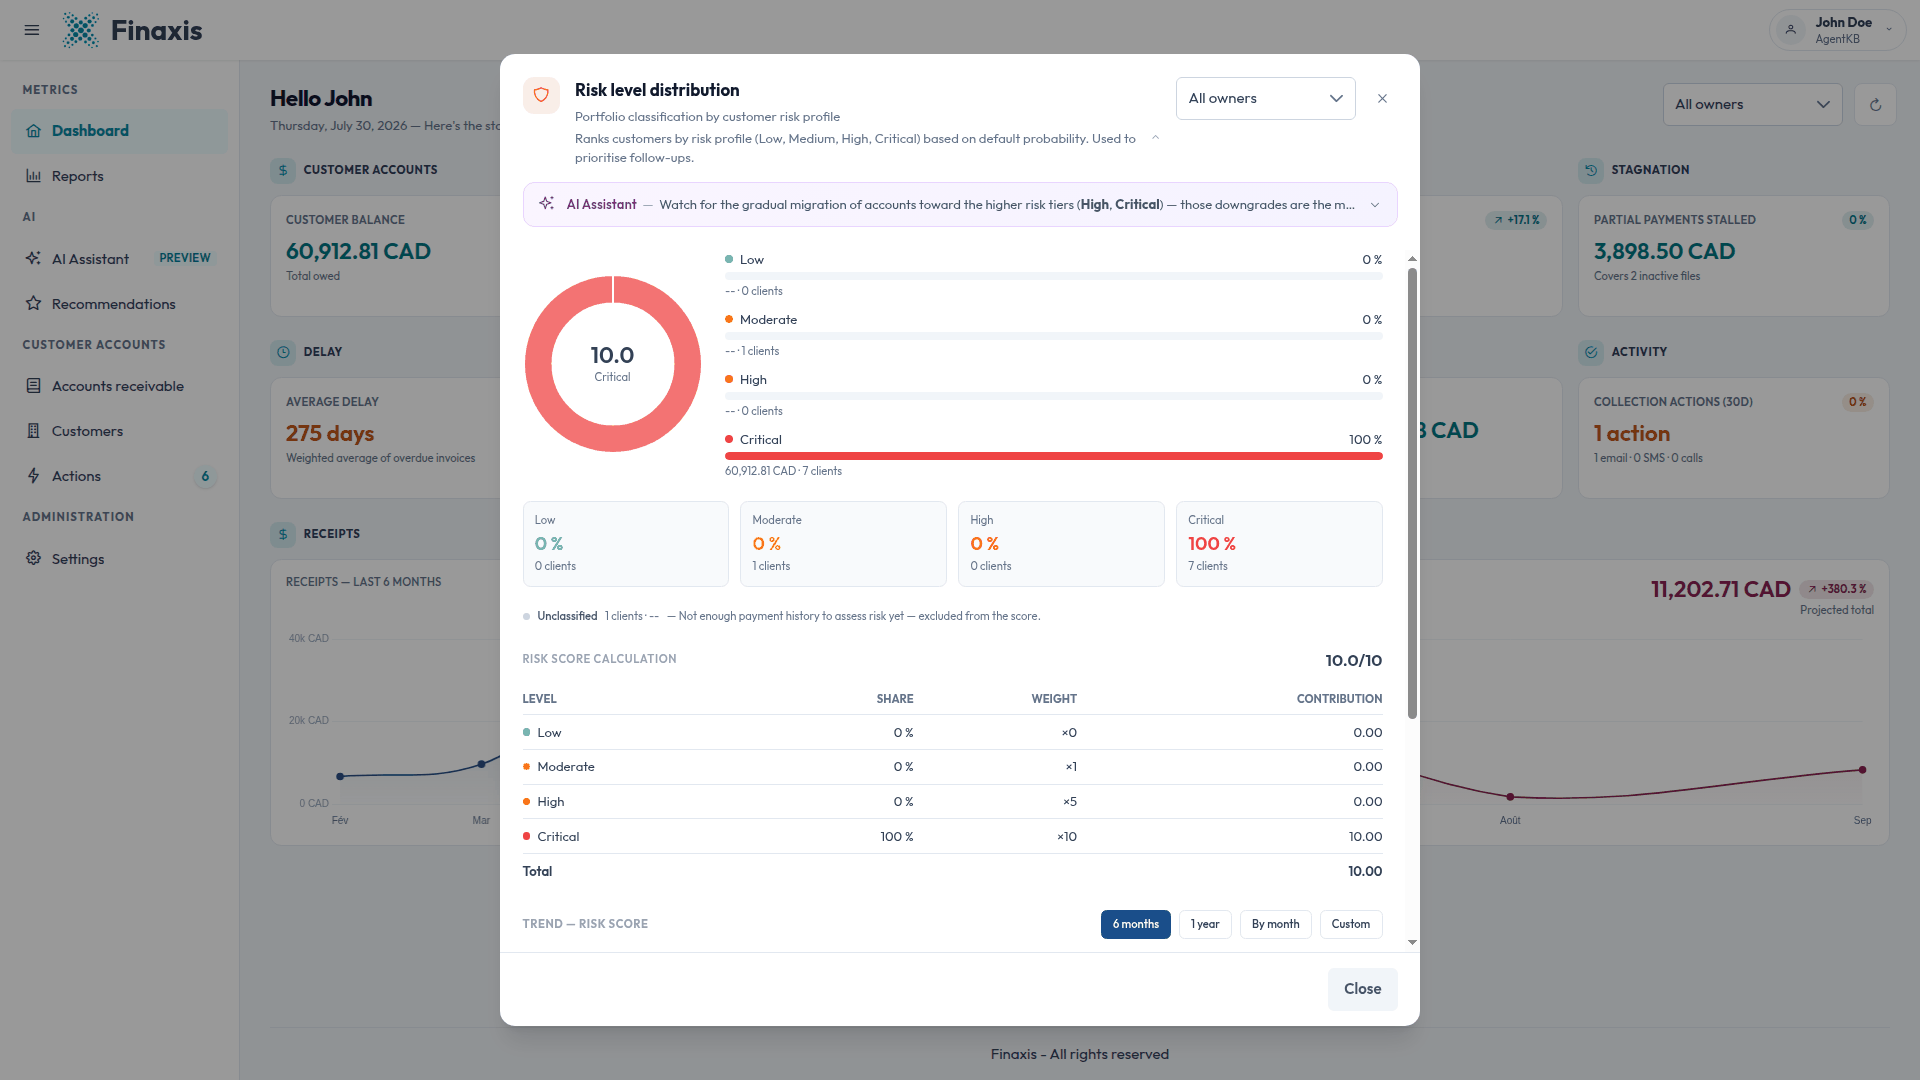
- Each level line gives its share of the balance, its amount, and its number of customers.
- The window lists an Unclassified group for customers with too little payment history to be graded. They are excluded from the score.
- The trend chart replays the score over the period you pick, so you can see levels drifting upward before they cost you.
Please note: This risk is not the payment risk badge on your accounts receivable list. The dashboard grades a customer on its payment history, while the badge on the aging report reads the mix of aging columns on that one row. The same customer can carry a different level in the two places, and both are correct for what they measure.
Concentration
Concentration answers a question about dependency rather than lateness: how much of what you are owed rests on your biggest customers. The higher it is, the more one customer going under would hurt.
Finaxis divides the balance of your N largest customers by your total portfolio balance, and reports it at three depths.
| Line | What it tells you |
|---|---|
| Top 1 customer | The share held by your single largest debtor. |
| Top 5 customers | The share held by your five largest. This is the figure shown on the tile. |
| Top 10 customers | The share held by your ten largest. It reaches 100 % when you have ten customers or fewer with an open balance. |
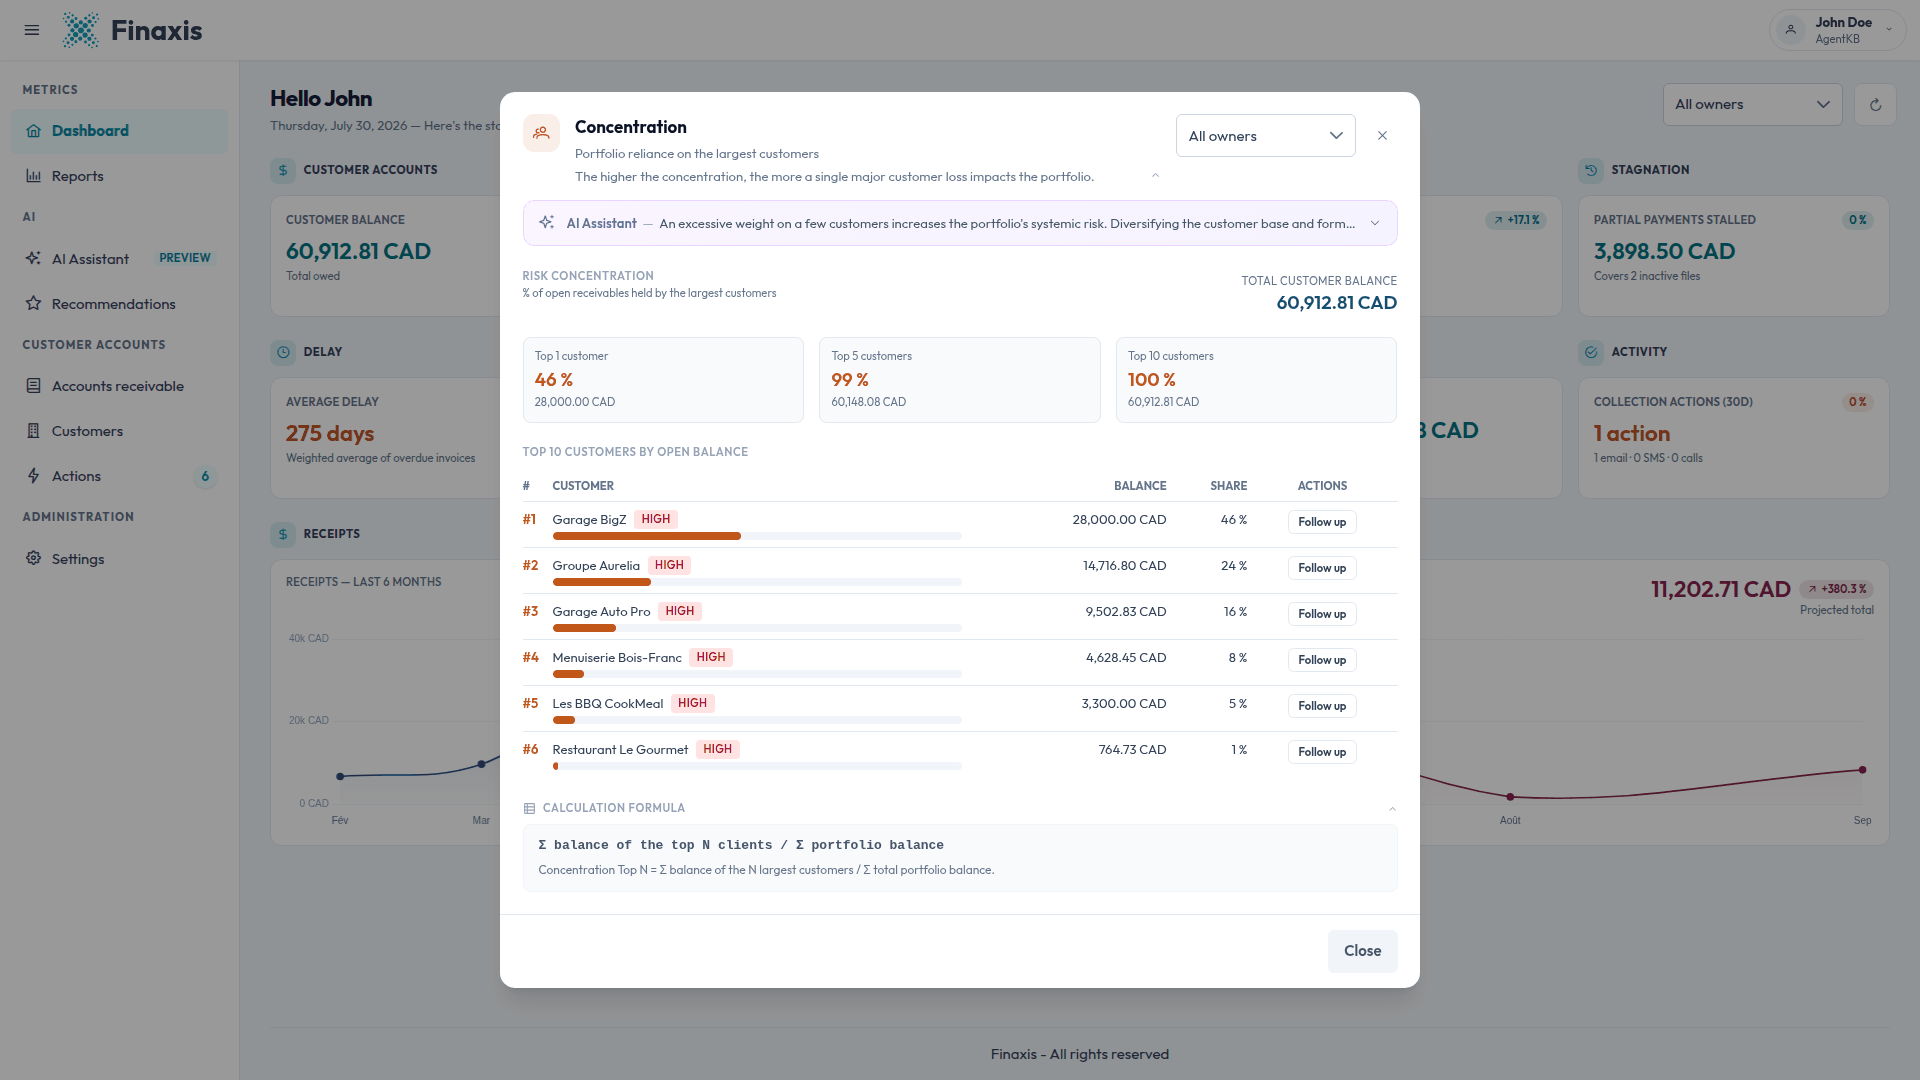
- The table ranks your ten largest customers with their balance, their share, and their risk level.
- Click Follow up on a row to start a reminder for that customer.
- This window has no trend chart. It describes your portfolio shape right now.
Please note: Concentration is calculated on the open balance, not on the overdue part. A large customer who always pays on time still raises your concentration, because the dependency is real even when the payment behaviour is good.
Collection actions
This tile counts the follow-ups your team actually made over the last 30 days, across all three channels. It is the one tile that measures your own activity rather than your customers behaviour.
| Channel | What is counted |
|---|---|
| Emails | Collection emails sent from Finaxis. |
| Text messages | Collection messages sent by SMS. |
| Call notes | Phone calls you logged as a call note on a customer. |
The window breaks the total down per channel with each share of the volume, and the trend chart replays the action count over the period you pick.
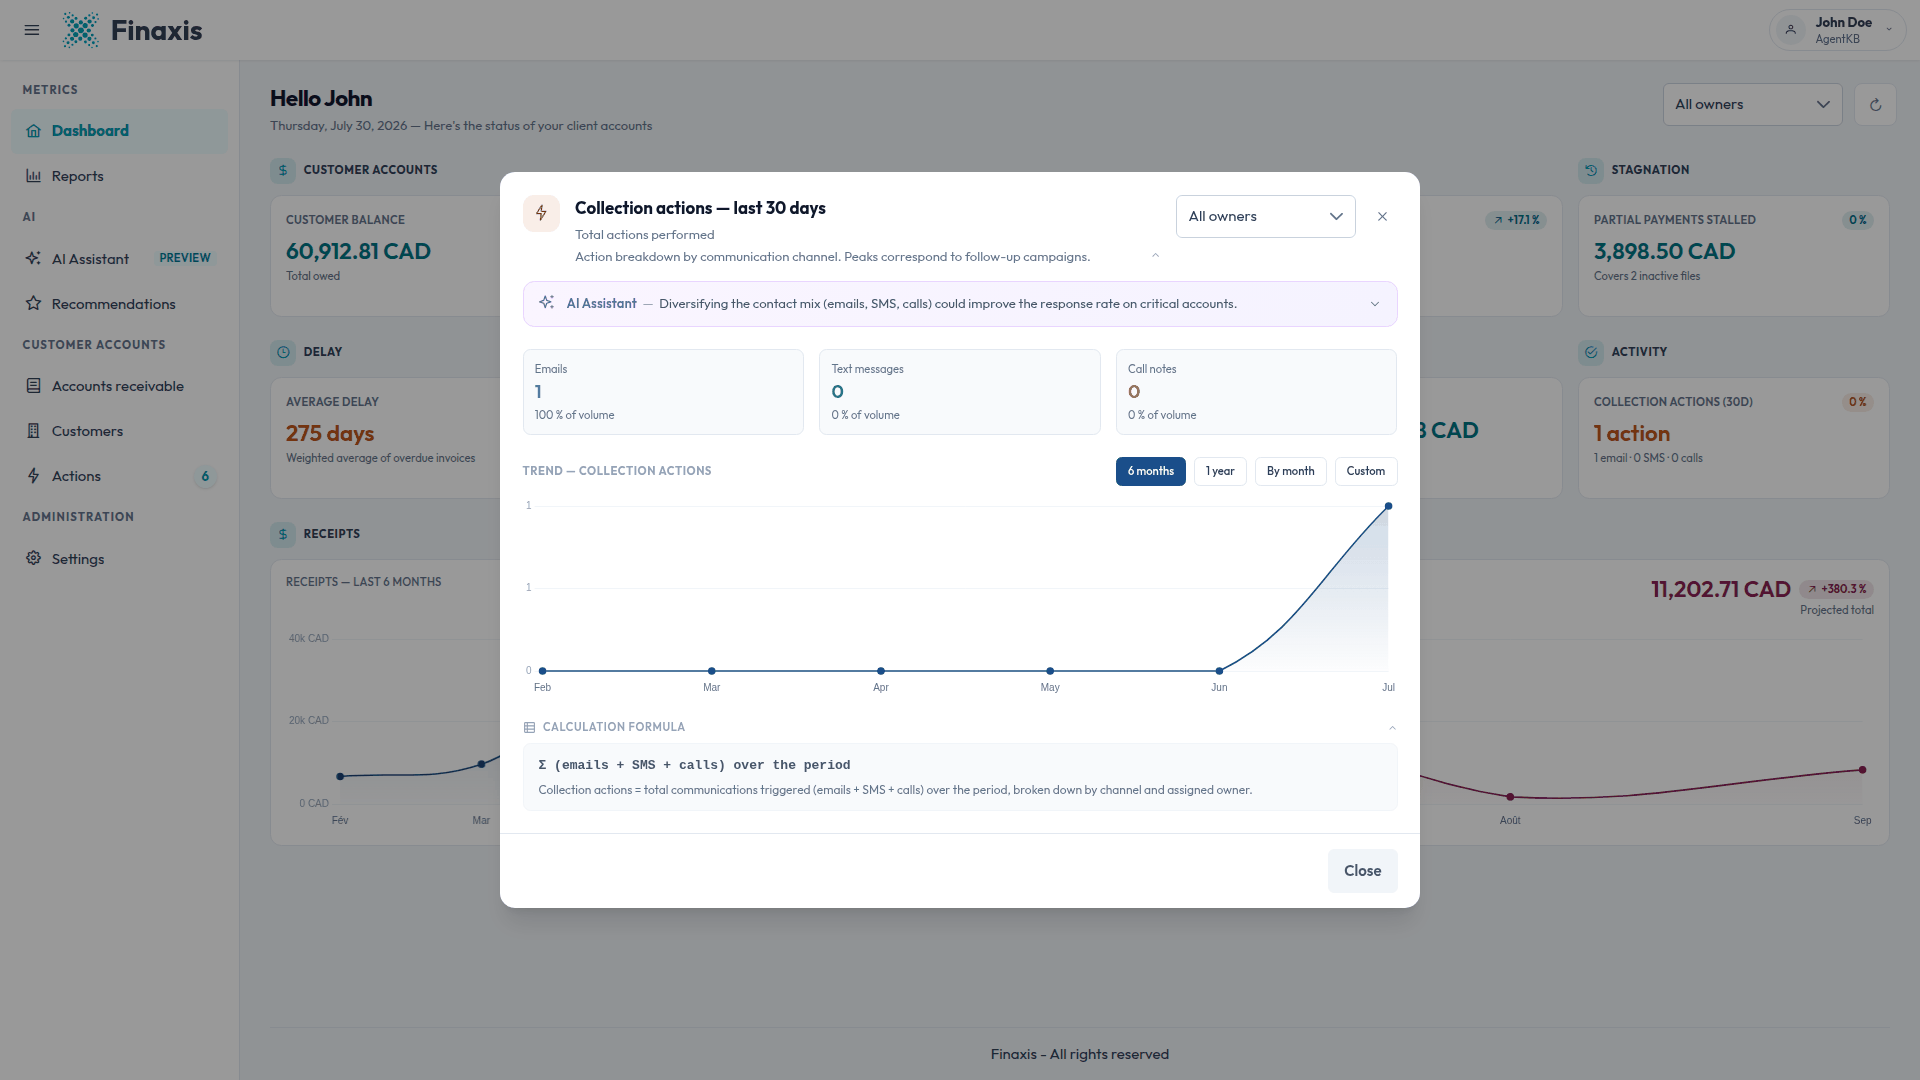
Please note: Phone calls only count once you log them. If your team calls customers without leaving a call note, the tile understates what the team is doing.
The tile total covers the last 30 days counted back from today, while the trend chart counts by calendar month or calendar day. The most recent point on the chart therefore need not match the tile figure, because the two describe different windows.
Reading the three together
- A high risk score with a low concentration means the problem is spread across many weak payers. Work the aging report by risk level.
- A low risk score with a high concentration means your book is healthy but fragile. One large account deserves its own attention.
- A high risk score with almost no collection actions means the exposure is not being chased. Start from the Balance without follow-up tile.
- Rising collection actions with a flat risk score means your outreach is not landing yet. Try changing channel on the critical accounts.
Troubleshooting
| Situation | What to do |
|---|---|
| The risk score is 10 out of 10 | Your whole graded balance sits on Critical customers. Open the window and read the calculation table to confirm which level holds the share. |
| A customer risk level differs from the aging report badge | That is expected. The dashboard grades payment history, the aging report reads the aging mix of the row. |
| Customers are listed as Unclassified | There is not enough payment history to grade them yet. They stay out of the score until they have one. |
| Concentration shows 100 % on the Top 10 line | You have ten or fewer customers with an open balance, so the ten largest are all of them. |
| Collection actions shows zero | No email, text message, or call note was recorded in the last 30 days for the selected owner. Widen the owner list to All owners to check. |
| The variation badge on these tiles stays at 0 % | The badge is neutral on both risk tiles and on collection actions. Read the trend chart inside the window instead. |
Want the exact weights or formula on screen? Open the tile and expand Calculation formula. For anything that still does not add up, write to support@finaxis.ai.
Related articles
Can't find what you're looking for?
Our support team is here to help.